
















































































How is Coin Hype Determined?
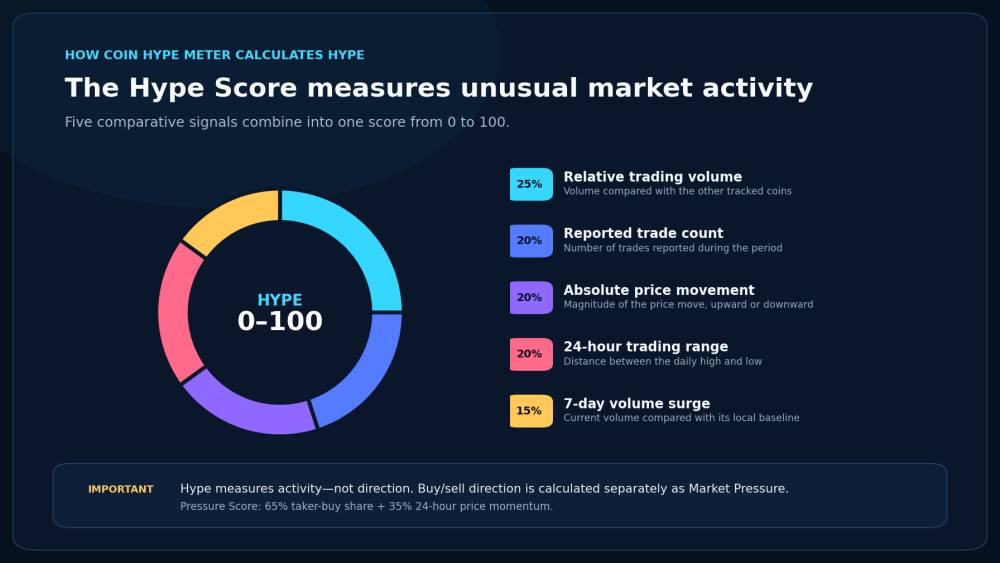
Coin Hype Meter uses a combination of market activity measurements. It does not determine hype from price movement alone.
The Hype Score is calculated from five components:
| Component | Weight |
|---|---|
| Trading volume relative to tracked coins | 25% |
| Number of reported trades | 20% |
| Absolute price movement, up or down | 20% |
| Size of the 24-hour trading range | 20% |
| Volume surge compared with the coin’s local seven-day baseline | 15% |
This produces a comparative score from 0 to 100. A coin receives a higher hype score when it has unusually strong volume, many trades, substantial price movement, a wide trading range, or volume that is elevated compared with its recent history.
Importantly, both a sharp increase and a sharp decrease can create high hype because the Hype Score measures attention and activity—not whether the price direction is favorable.
Buy and sell direction is measured separately by the Pressure Score:
- 65% comes from the proportion of taker-buy activity versus selling activity.
- 35% comes from 24-hour price momentum.
Pressure ranges from approximately -100 to +100:
- A positive number indicates buying pressure.
- A negative number indicates selling pressure.
- A number near zero indicates relatively balanced activity.
So, in plain language:
- Hype Score: “How unusually active is this coin?”
- Pressure Score: “Does that activity lean toward buying or selling?”
This distinction allows a coin to have high hype with strong selling pressure, high hype with strong buying pressure, or low hype with little meaningful activity.